
BSE Limited, India’s oldest stock exchange, is making headlines once again — not just for its legacy, but for the powerful technical setup it has formed recently. After a brutal correction and months of uncertainty, the stock has bounced back strongly, attracting traders’ and investors’ attention.
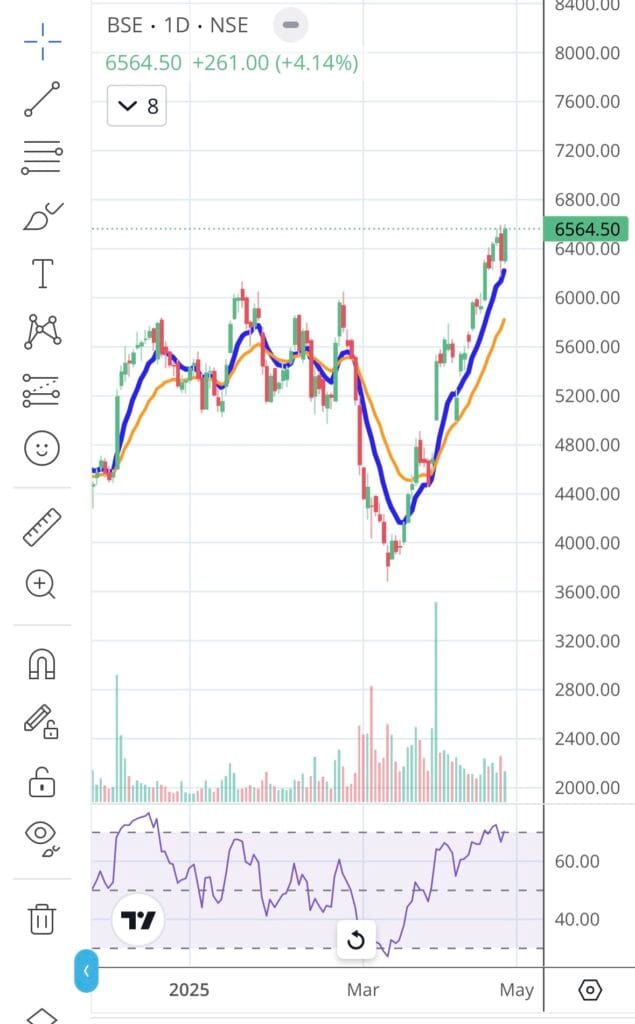
On the daily chart on April 29, 2025, BSE closed at ₹6564.50, posting a solid 4.14% gain in the latest session. While the trend appears bullish, the sharp rally raises an important question: Is there more steam left, or are we nearing a short-term top?
Let’s break down the technicals for a better understanding.
A Deep Correction Followed by a Strong Comeback
If we zoom out, BSE underwent a heavy correction from around ₹6000 to ₹4000 between 2024 and early 2025 — a nearly 33% fall. Such deep corrections often shake out weak hands and set the stage for a long-term trend reversal.
From February 2025 onwards, BSE started forming a V-shaped recovery, indicating strong buying at lower levels. The sharpness of the move suggests that institutional buying could have played a role in the comeback.
Importantly, the rally wasn’t random — it was structured, respecting key technical levels, and now the stock is attempting to break into uncharted territories once again.
Moving Averages Signal Strong Uptrend
Looking at the moving averages:
- The Blue Line represents the 9 EMA, a short-term trend indicator.
- The Orange Line represents the 20 EMA, a medium-term trend indicator.
Currently, BSE is trading well above both the 9 EMA and 20 EMA, and the 9 EMA is above the 20 EMA, showing a perfect bullish alignment.
This crossover indicates that momentum is not only strong but also sustainable — as long as the stock remains above the 20 EMA, bulls are clearly in control.
Moreover, every minor dip toward the 9 EMA is being bought aggressively, showing that short-term traders are heavily active, keeping the uptrend alive.
Volume Behavior – Quietly Supporting the Rally
Volume analysis is equally important to confirm any breakout.
During the recent rally, the up days have consistently seen higher volumes compared to the down days.
Even though volumes have slightly tapered off in the last few sessions, they remain above the average volumes seen during the previous consolidation phase — a healthy sign that buyers are still interested.
An explosion in volume on further breakouts above ₹6800 would be the next strong confirmation signal.
RSI (Relative Strength Index) Observation
The RSI is now hovering close to the 70 mark, technically entering the overbought territory.
But remember:
- In strong trends, RSI can remain overbought for an extended period without immediate corrections.
- Overbought RSI should not be seen as a sell signal on its own — it simply suggests that a small pause or consolidation could happen.
Thus, while the broader trend remains bullish, traders should prepare for possible sideways movement or minor pullbacks to digest recent gains.
Key Support and Resistance Zones
Supports:
- Immediate Support: ₹6200–₹6300. This zone was the previous resistance that has now turned into support. Short-term traders should watch this area closely.
- Major Support: ₹5800. A breakdown below this would indicate a deeper correction phase.
Resistances:
- Immediate Resistance: ₹6800–₹7000. Psychologically important levels and minor selling pressure can be expected here.
If BSE manages to cross ₹7000 decisively with high volume, it could set itself up for a fresh rally toward ₹7500–₹8000.
Short-Term Risks to Consider
While the current chart is strong, there are a few caution points:
- Vertical Rise: Stocks that climb vertically are prone to sudden 8–10% corrections without much warning.
- Broader Market Risk: If the Nifty or Sensex faces a correction, BSE could also get dragged down temporarily.
- Profit Booking: Traders who bought during the February-March recovery might soon start booking profits, leading to volatile sessions.
Trading and Investment Strategy
For Short-Term Traders:
Avoid chasing the stock at highs. Instead, look for dips toward the 9 EMA (~₹6400 currently) or 20 EMA (~₹6200–₹6300) zones for fresh entries. Keep a tight stop-loss below ₹6200.
For Positional Investors:
If already holding, stay invested and trail your stop-loss higher. Fresh entries for long-term investors can also be considered around ₹6300 if the stock pulls back and holds firm.
Important Tip:
Don’t forget to trail your stop loss as the stock moves up. In strong trending markets, trailing stops help lock profits while staying in the trend.
Conclusion
BSE Limited has shown impressive strength in the past couple of months. The stock has broken out of a long consolidation zone and is moving up sharply, supported by favorable technical indicators like bullish EMA alignment, healthy volumes, and sustained RSI momentum.
While some caution is warranted due to overbought conditions, the broader trend remains positive. Smart money appears to be accumulating, and unless the ₹5800 support is broken decisively, the stock looks poised to target ₹6800–₹7000 and even higher over the next few weeks.
As always, discipline and proper risk management are key — but there’s no denying that BSE is one of the stronger technical setups in the market right now.